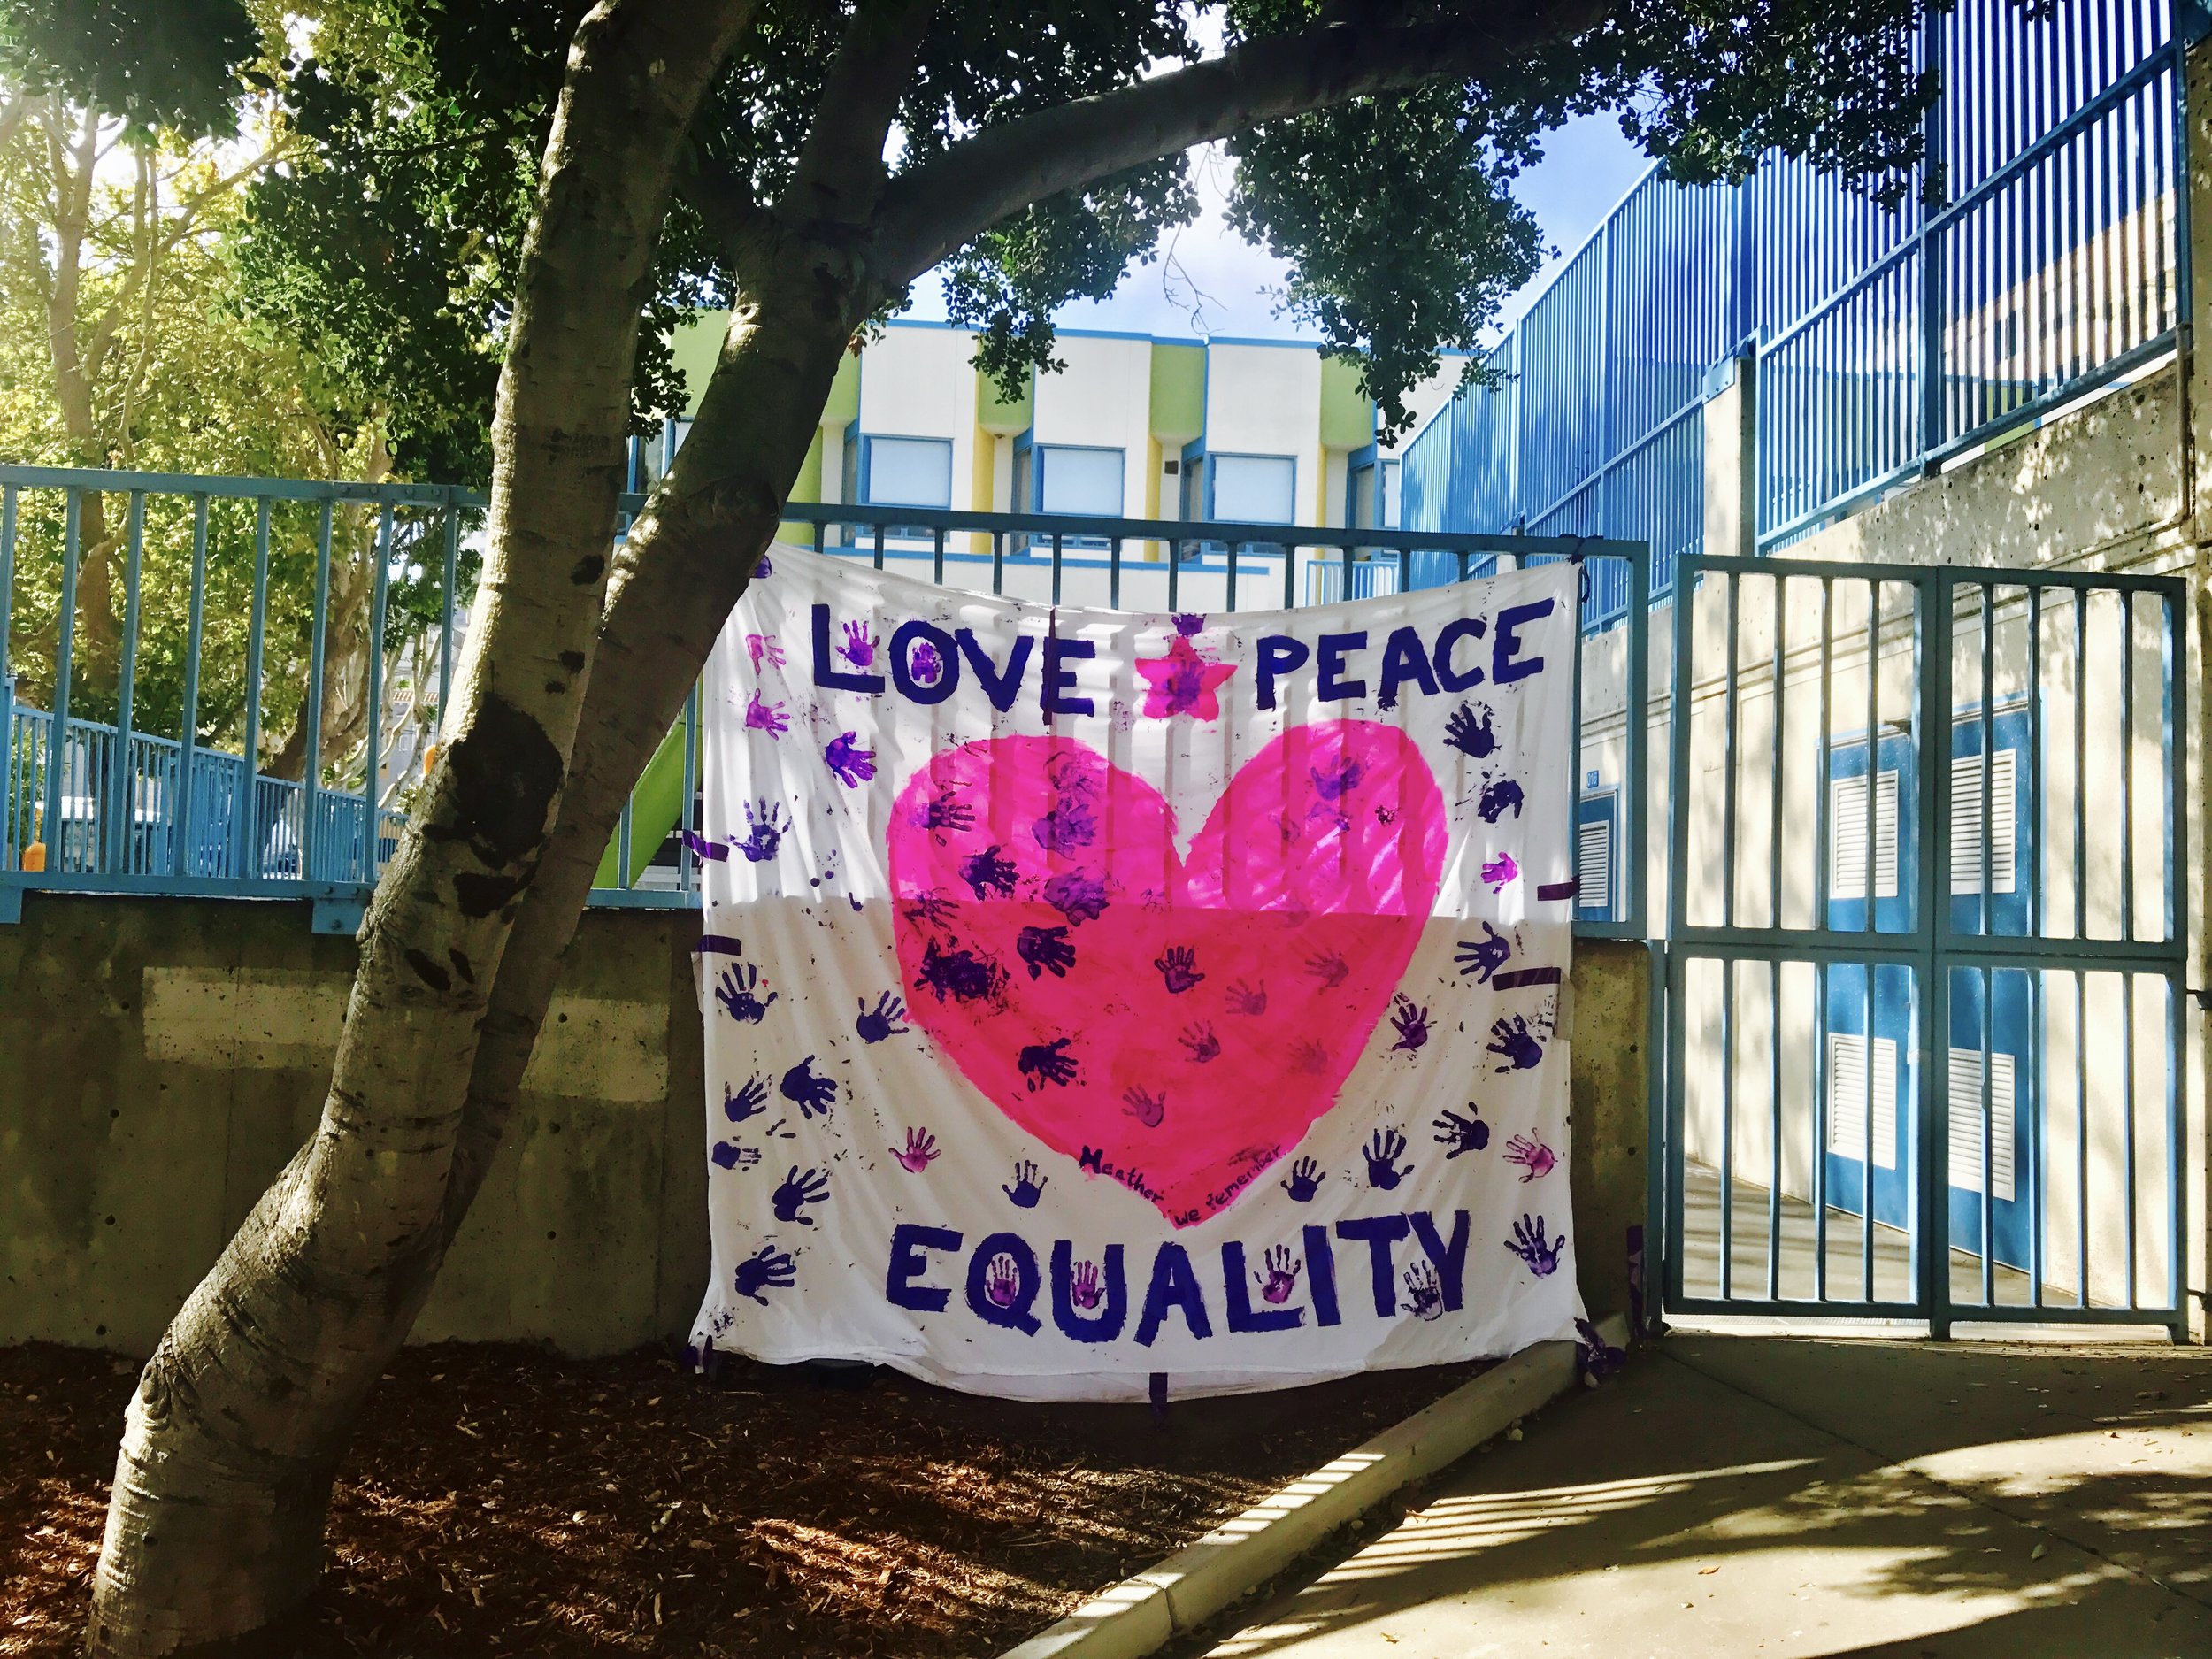
Yesterday the New York Times ran an op-ed by Temple law professor Peter Spiro that has people talking. Spiro thinks that SB 1070 is “misguided at best, mean-spirited and racially tainted at worst.” But he also thinks that the Supreme Court, which is set to hear arguments on SB 1070 tomorrow, should uphold the law. How to explain this seeming discordance?
Basically, Spiro has thought harder about this whole thing than most of us have. He’s thinking practically, pragmatically. For most of us who agree with Spiro’s sterner formulation of SB 1070 — i.e., that it’s “mean-spirited and racially tainted” — our first reaction is to cry out for the law’s repeal; it’s a crummy law and it should go away, dammit.
But in our indignation, how many of us ever stop to think about how a repeal would actually play out in the complex machinery of our legal system? Well, Spiro has. He predicts, for one thing, that if the court strikes down SB 1070, a backlash will follow that will include a renewed push to pass federal anti-immigration measures. It’s hard to guess just how likely this is (Ilya Somin is skeptical), but it certainly sounds plausible, so it’s something we should at least be mulling over.
Spiro also claims that there’s a state-by-state route to pro-immigration policies and that therefore it’s unnecessary for the court to affirm the federal government’s legal supremacy in the field. He argues that local farmers, business owners, human rights advocates, and union organizers will align against anti-immigration bills. State legislatures won’t be able to maintain these policies in the face of such concerted opposition. And they’ll be further tempted to reverse course when they see that their neighbors are thriving after welcoming in the big pool of workers that fled their (i.e., the first state’s) draconian laws.
Say Spiro is right about this. Say he’s right that “One of federalism’s core virtues is the possibility of competition among states” and that “Competition in this context is likely to vindicate pro-immigrant policies.” Why rely on “likely” when the Supreme Court can make certain that laws like SB 1070 disappear?
Spiro’s use of the word “vindicate” suggests one reason. If the court were to strike down SB 1070, the law’s supporters would get really angry. It would be extremely polarizing. You might read about new vigilante border-patrol groups. You might see increased violence against immigrants. You might hear more vitriol in mainstream political discourse.
What if, on the other hand, state anti-immigration measures were to “wither away,” as Spiro puts it, via a process of local interest-group lobbying and interstate competition? This might take a bit longer than a sweeping court decision, but it would likely unfold in such a way that the folly of laws like SB 1070 became more obvious to more people. There would be greater consensus around the repeal of such laws. In this way, pro-immigrant policies would be “vindicated” in a way they wouldn’t be by a Supreme Court decision. We’d get the result we wanted from the beginning, but with less residual acrimony and potential for future flare-ups. We’d just have to wait a little longer for it.
So Spiro makes some compelling points. But is he right? Impossible to say. What is possible to say is that in indulging our indignation, we often fail to appreciate the complexity of the thing we’re indignant about. Spiro’s op-ed shows us that.
UPDATE: Senate Democrats are preparing legislation to be unleashed if the Supreme Court upholds SB 1070. According to the Washington Post, the proposed law would require federal approval for new state immigration laws. But the bill is purely political. The Democrats know the bill won’t pass; it’s about trying to make conservative lawmakers offend certain constituencies going into the election. Spiro didn’t foresee that in his op-ed….
UDPATE #2: At reason.com, Jacob Sullum says the discussion above is beside the point.
But the shock of the night was a record 18 per cent performance by the National Front’s Marine Le Pen, who outdid pollsters’ predictions after capitalising on widespread French discontent with the mainstream political elite.
That’s from the Financial Times. Chief among Le Pen’s gripes with the “mainstream political elite” is what she perceives as the mainstream’s insufficiently jingoistic positions on immigration. It seems this is her chief appeal to many of her supporters, as well. A few days ago, Financial Times foreign affairs columnist Gideon Rachman wrote this about a Le Pen rally:
It was not until the last 15 minutes of a speech that must have lasted a good hour that the candidate got onto the subject that really got her audience going – immigration. Marine Le Pen has been trying to campaign on a wider variety of subjects than her father; perhaps to broaden the party’s appeal, or perhaps to defuse the charge of racism. But it was the denunciation of the impact of mass immigration on France, the FN’s [Le Pen's party, the Front National] founding cause, that really got her supporters out of their seats, cheering and chanting.
And Rachman added this troubling bit:
What was striking, however, was the number of young people at the rally. One of the more startling opinion polls of the campaign, was one in Le Monde that showed that Le Pen is actually in the lead among young voters.
With 18 percent of first-round voting and a top showing among young people, Le Pen is no fringe candidate. Indeed, many reporters noted throughout the campaign that she carried enough weight to push incumbent Nicolas Sarkozy significantly rightward on immigration. Disquieting stuff.
The redoubtable Felix Salmon blogged yesterday about Ann Lee’s New York Times op-ed on the EB-5 visa program, just like we did. He makes a point similar to one we made — namely that trying to “fix” the EB-5 system is likely to be an exercise is futility and folly and that it should just be totally jettisoned in favor of something much simpler and more immigrant-friendly.
Not surprisingly, his argument is a bit richer than ours. We claimed, simply, that EB-5 should be scrapped because it’s run by a big corrupt bureaucracy, and big corrupt bureaucracies are generally immune to worthwhile reform. Salmon seems to agree with this thinking. But he claims that the problem goes beyond this. USCIS hasn’t screwed up EB-5 simply because it’s full of bureaucrats; it’s screwed up EB-5 because its bureaucrats are opposed to EB-5′s very aims:
… for all the efforts by people like Napolitano and Lee to revamp the EB-5 system, they’re going to find doing so extremely difficult. Reuters found what immigration attorney Ira Kurzban calls “a basic hostility to the EB-5 program inside USCIS”, which is at heart a reflexive opposition to the idea that anybody can buy their way into the country. Despite the fact, of course, that the whole point of the EB-5 program is to enable exactly that.
Those of us who have had dealings with USCIS know that it is always looking for an excuse to say no: even people like me who get our green cards the “easy” way, by marrying a US citizen, find the process extremely fraught. [Salmon is from the U.K.] No matter how much money I was earning, for instance, the USCIS would not let me have a green card unless my wife could demonstrate that she was earning enough, on her own, to support me. And a friend of mine, after marrying a US citizen and having two US children with her, actually got a notice of deportation at one point in his green card application saga, on the grounds that a certain piece of paperwork had been filed, years previously, a few days too late.
The TSA and the USCIS have grown, over the years, into agencies devoted to saying no. [Salmon also knocks the TSA in his blog post.] There’s very little downside, for these agencies, when they deport someone applying for a green card, or cause a mother to miss her flight because of a fight over breast milk. And it’s almost impossible to change that big-picture dynamic, no matter what Congress mandates, and no matter what the senior leadership in these organizations might want.
What to do about this mess? Salmon’s conclusions are similar to ours, except that he proposes an actual piece of legislation to provide a replacement for EB-5 once EB-5 is canned.
Which is why it makes sense to make skilled immigration as easy as possible. Resuscitate the Schumer-Lee bill giving a residency visa to anybody who spends at least $500,000 on a house here, except lower that number to $250,000, and make sure that the visa allows the homeowner to actually work and create jobs in this country. The less room there is for USCIS agents to say no, the more smoothly the program will run.
Will making immigration easier allow a few people into the country who weren’t the intended recipients of the bill’s generosity? Yes, of course. But all immigration is good for America. And with net migration from Mexico now down to zero, and the US economy desperately in need of entrepreneurial investment, now’s exactly the time to start opening our doors much wider.
There’s more wisdom to be found in the full piece. Read it here.
In today’s New York Times, Ann Lee, author of What the U.S. Can Learn from China, decries the ugly outcomes that pervade the EB-5 visa program. EB-5 visas were created in 1990 to attract foreign investors. Plop down half a million to a million dollars (depending on the area) and create ten jobs over two years and you get a green card.
The regulatory framework that was put in place to administer the program was relatively light. But any regulations attract rent-seekers, and EB-5 is no exception. Much of the corruption that Lee describes flows through the program’s 218 “regional centers,” which are licensed businesses that connect foreign lenders with U.S. borrowers. These centers often rely on globe-trotting brokers to identify potential investors. The brokers, it seems, tend to, er, prevaricate about the rules and guarantees of EB-5 and the promise of the investment opportunities in question. One common ploy is to ensure potential players that EB-5 loans are guaranteed by the U.S. government. In fact, they are not.
It’s unclear from Lee’s op-ed or the many-thousand-word Reuters investigation she cites just how deeply involved the regional centers themselves are in these deceptions. Lee claims that “Examples abound of centers and brokers playing down risky investments and misrepresenting how the program works.” The Reuters piece takes a couple pokes at some of the centers but has much juicier stuff on the brokers. Either way, it’s clear that opportunists are out there trying to score fat commissions in patently unscrupulous ways.
Which, of course, is how business works pretty much everywhere. We should boo and hiss at Jason Lee, who in the Reuters piece dishonestly and yes, illegally, promises a group of potential Chinese investors that an Idaho gold mine will repay their investment and then some. But shouldn’t we also expect a lender who’s about to hand over a half a million or a million bucks to perform due diligence on the investment? Lee recommends we “hire more business-savvy administrators and make the entire process more transparent.” If we hired enough business-savvy administrators to oversee all the shady pitches going on in U.S. commerce, there wouldn’t be many of us left to be firemen and teachers and investment bankers and dental assistants.
Op-eds end like this too often. “We must expand oversight and impose transparency on the process.” Usually this comes after several paragraphs outlining the various misdealings of the officials already hired to oversee and clarify the process. Indeed, EB-5 had its own such instance of ignominy in the late 1990s, when some INS insiders started a company that defrauded hundreds of immigrant investors. Why think the agencies charged with overseeing things will suddenly go squeaky-clean?
So then what’s the answer? One development that could help at least a little is the formation of the Association to Invest in the USA (IIUSA) (presumably the acronym AIUSA was already taken), a trade group that seeks to keep EB-5 opportunists acting ethically in their dealings.
A better fix would be to hand out green cards more liberally, with fewer restrictions. The enticement as it’s currently laid out gives regional centers and brokers tremendous power. They can dangle a green card over the conference table of a Shanghai boardroom, and many of the investors, tempted by the promise of U.S. residency, will fork over cash without asking the usual questions. The dangled green card distorts their sense of risk. Better if Congress would just say, “You’re not a criminal and you have lots of money? Great! Come work and live in the U.S.!” And that’s it. Green cards without the attached conditions that invite corruption. The immigrants would help make the economy expand, because they like to invest and produce and make money just like we do. They don’t have to be induced to do it. The middlemen would lose their clout. Everyone but the opportunistic gougers would win.
Well, almost everyone. The anti-immigrant crowd wouldn’t win, which is why this plan won’t fly anytime soon. Maybe some day.
At The Atlantic, Julia Lurie gives us something we can always use more of: narrative reporting on actual undocumented immigrants, complete with names and physical descriptions and accounts of honest, everyday pursuits-of-happiness foiled — or at least seriously imperiled — by current immigration law.
The subjects of Lurie’s piece are paperless young people in Connecticut. Lurie tells us about a group of students there who have formed a non-profit organization that advocates for policies of the DREAM Act variety. And she conveys the struggles of two young men, Nico and Raul, who could really benefit from such policies. Both came here with their parents when they were still little kids, and both face serious barriers to getting college educations, even though they’ve proved more than willing and able.
The closing paragraphs really squeeze the sour juice from the immigration-policy lemon:
The sun sets outside as I sit with Nico in the office of a local non-profit where he spends his afternoons doing homework. When I open my laptop to show him a list of scholarships he’s eligible for, I offhandedly point out that my desktop background is a picture from a trip I took to Guatemala, Nico’s country of birth. His face lights up.
We spend the next half hour looking through pictures of my trip, suspended in the absurdity of the situation: I’m an American citizen showing Nico pictures and telling him stories from my travels. And he, who has virtually no recollection of this place — who later tells me that seeing them was the highlight of his day — can’t work or drive or travel or get healthcare or pursue an education in America. All because of his affiliation with this place — a place that he doesn’t remember but that we insist he call “home.”
Lurie’s right. It’s absurd. Maybe she overdoes the theatrical drama a bit. (How likely is it that her remark about having a photo of Nico’s forgotten, burdensome homeland on her desktop was really “offhand”?) But no matter. Contrived or not, it’s a sorry coincidence.
Today the Migration Policy Institute published a handy fact sheet that brings together the most up-to-date immigration data. (The word “handy” comes from their own press release. And handy it is.) Key figures:
POPULATION
According to the 2010 U.S. Census, there are 40 million immigrants living in the United States. That’s 13 percent of a total U.S. population of 309.3 million.
17.5 million (44 percent) of those 40 million immigrants are naturalized citizens.
Mexico natives account for 29 percent of those 40 million immigrants. Next comes China, at 5 percent. India and the Philippines account for 4 percent each. Vietnam, El Salvador, Cuba, and Korea account for 3 percent each.
Immigrants accounted for 25.5 million (16 percent) of the 155.8 million workers in the U.S. civilian labor force in 2010.
GEOGRAPHY
The five states whose immigrant populations grew most, in absolute terms, were all in the south: Alabama (92 percent), South Carolina (88 percent), Tennessee (82 percent), Arkansas (79 percent), and Kentucky (75 percent). Below is a big sortable table with data for all states.
VISAS
In 2010, 1,042,625 foreign nationals became lawful permanent residents (a.k.a., green-card holders) in the United States.
Of this roughly one million:
- 46 percent were immediate relatives of a U.S. citizen;
- 21 percent came through a family-sponsored preference (i.e., relatives that are less likely to be dependent on you than those in the previous group);
- 14 percent came through an employment-based preference;
- 13 percent were adjusted from refugree or asylee status;
- 5 percent were Diversity Visa Lottery winners.
The names of these roughly 50,000 Diversity Visa Lottery winners were plucked out of a hat containing 14.8 million applications! This means we let in 0.3 percent of the qualified (high-school educated, previously employed, healthy) people who wanted to come live in our country.
UNAUTHORIZED
According to the Pew Hispanic Center, there were 11.2 million unauthorized immigrants living in the United States as of March 2010. That’s about 28 percent of the total immigrant population of 40 million.
Customs and Border Protection (CBP) has a budget of $11.7 billion for FY 2012, the highest amount of any agency in the Department of Homeland Security.
Immigration and Customs Enforcement, the investigative branch of DHS, is operating on a budget of $5.9 billion in FY 2012.
There are right now about 21,000 Border Patrol agents.
TABLE
These figures come straight from the MPI website, which came from the U.S. Census Bureau. Click on the column headings to sort the data.
| State |
In 2000, total population of foreign-born residents |
In 2000, percentage of state’s total population that was foreign-born |
In 2010, total population of foreign-born residents |
In 2010, percentage of state’s total population that was foreign-born |
From 2000 to 2010, rate of growth of state’s total population of foreign-born residents |
From 2000 to 2010, change in percentage of state’s total population that was foreign-born |
| United States |
31,107,889 |
11.1% |
39,955,854 |
12.9% |
+28.44% |
+1.86% |
| California |
8,864,255 |
26.2% |
10,150,429 |
27.2% |
+14.51% |
+1.01% |
| New York |
3,868,133 |
20.4% |
4,297,612 |
22.2% |
+11.10% |
+1.78% |
| New Jersey |
1,476,327 |
17.5% |
1,844,581 |
21.0% |
+24.94% |
+3.41% |
| Florida |
2,670,828 |
16.7% |
3,658,043 |
19.4% |
+36.96% |
+2.70% |
| Nevada |
316,593 |
15.8% |
508,458 |
18.8% |
+60.60% |
+2.96% |
| Hawaii |
212,229 |
17.5% |
248,213 |
18.2% |
+16.96% |
+0.69% |
| Texas |
2,899,642 |
13.9% |
4,142,031 |
16.4% |
+42.85% |
+2.49% |
| Massachusetts |
772,983 |
12.2% |
983,564 |
15.0% |
+27.24% |
+2.82% |
| Maryland |
518,315 |
9.8% |
803,695 |
13.9% |
+55.06% |
+4.10% |
| Illinois |
1,529,058 |
12.3% |
1,759,859 |
13.7% |
+15.09% |
+1.39% |
| Connecticut |
369,967 |
10.9% |
487,120 |
13.6% |
+31.67% |
+2.75% |
| District of Columbia |
73,561 |
12.9% |
81,734 |
13.5% |
+11.11% |
+0.66% |
| Arizona |
656,183 |
12.8% |
856,663 |
13.4% |
+30.55% |
+0.57% |
| Washington |
614,457 |
10.4% |
886,262 |
13.1% |
+44.23% |
+2.72% |
| Rhode Island |
119,277 |
11.4% |
134,335 |
12.8% |
+12.62% |
+1.38% |
| Virginia |
570,279 |
8.1% |
911,119 |
11.4% |
+59.77% |
+3.30% |
| New Mexico |
149,606 |
8.2% |
205,141 |
9.9% |
+37.12% |
+1.71% |
| Colorado |
369,903 |
8.6% |
497,105 |
9.8% |
+34.39% |
+1.25% |
| Oregon |
289,702 |
8.5% |
375,743 |
9.8% |
+29.70% |
+1.32% |
| Georgia |
577,273 |
7.1% |
942,959 |
9.7% |
+63.35% |
+2.66% |
| Utah |
158,664 |
7.1% |
222,638 |
8.0% |
+40.32% |
+0.91% |
| Delaware |
44,898 |
5.7% |
71,868 |
8.0% |
+60.07% |
+2.26% |
| North Carolina |
430,000 |
5.3% |
719,137 |
7.5% |
+67.24% |
+2.18% |
| Minnesota |
260,463 |
5.3% |
378,483 |
7.1% |
+45.31% |
+1.83% |
| Alaska |
37,170 |
5.9% |
49,319 |
6.9% |
+32.68% |
+0.98% |
| Kansas |
134,735 |
5.0% |
186,942 |
6.5% |
+38.75% |
+1.53% |
| Nebraska |
74,638 |
4.4% |
112,178 |
6.1% |
+50.30% |
+1.77% |
| Michigan |
523,589 |
5.3% |
587,747 |
6.0% |
+12.25% |
+0.68% |
| Pennsylvania |
508,291 |
4.1% |
739,068 |
5.8% |
+45.40% |
+1.68% |
| Idaho |
64,080 |
5.0% |
87,098 |
5.5% |
+35.92% |
+0.59% |
| Oklahoma |
131,747 |
3.8% |
206,382 |
5.5% |
+56.65% |
+1.67% |
| New Hampshire |
54,154 |
4.4% |
69,742 |
5.3% |
+28.78% |
+0.91% |
| South Carolina |
115,978 |
2.9% |
218,494 |
4.7% |
+88.39% |
+1.82% |
| Indiana |
186,534 |
3.1% |
300,789 |
4.6% |
+61.25% |
+1.57% |
| Iowa |
91,085 |
3.1% |
139,477 |
4.6% |
+53.13% |
+1.46% |
| Tennessee |
159,004 |
2.8% |
288,993 |
4.5% |
+81.75% |
+1.75% |
| Arkansas |
73,690 |
2.8% |
131,667 |
4.5% |
+78.68% |
+1.75% |
| Wisconsin |
193,751 |
3.6% |
254,920 |
4.5% |
+31.57% |
+0.87% |
| Vermont |
23,245 |
3.8% |
27,560 |
4.4% |
+18.56% |
+0.58% |
| Ohio |
339,279 |
3.0% |
469,748 |
4.1% |
+38.45% |
+1.08% |
| Missouri |
151,196 |
2.7% |
232,537 |
3.9% |
+53.80% |
+1.18% |
| Louisiana |
115,885 |
2.6% |
172,866 |
3.8% |
+49.17% |
+1.21% |
| Alabama |
87,772 |
2.0% |
168,596 |
3.5% |
+92.08% |
+1.55% |
| Maine |
36,691 |
2.9% |
45,666 |
3.4% |
+24.46% |
+0.56% |
| Kentucky |
80,271 |
2.0% |
140,583 |
3.2% |
+75.14% |
+1.25% |
| Wyoming |
11,205 |
2.3% |
15,843 |
2.8% |
+41.39% |
+0.54% |
| South Dakota |
13,495 |
1.8% |
22,238 |
2.7% |
+64.79% |
+0.94% |
| North Dakota |
12,114 |
1.9% |
16,639 |
2.5% |
+37.35% |
+0.58% |
| Mississippi |
39,908 |
1.4% |
61,428 |
2.1% |
+53.92% |
+0.67% |
| Montana |
16,396 |
1.8% |
20,031 |
2.0% |
+22.17% |
+0.20% |
| West Virginia |
19,390 |
1.1% |
22,511 |
1.2% |
+16.10% |
+0.14% |